Google Data Studio SEO Dashboard: 2026 Setup Guide
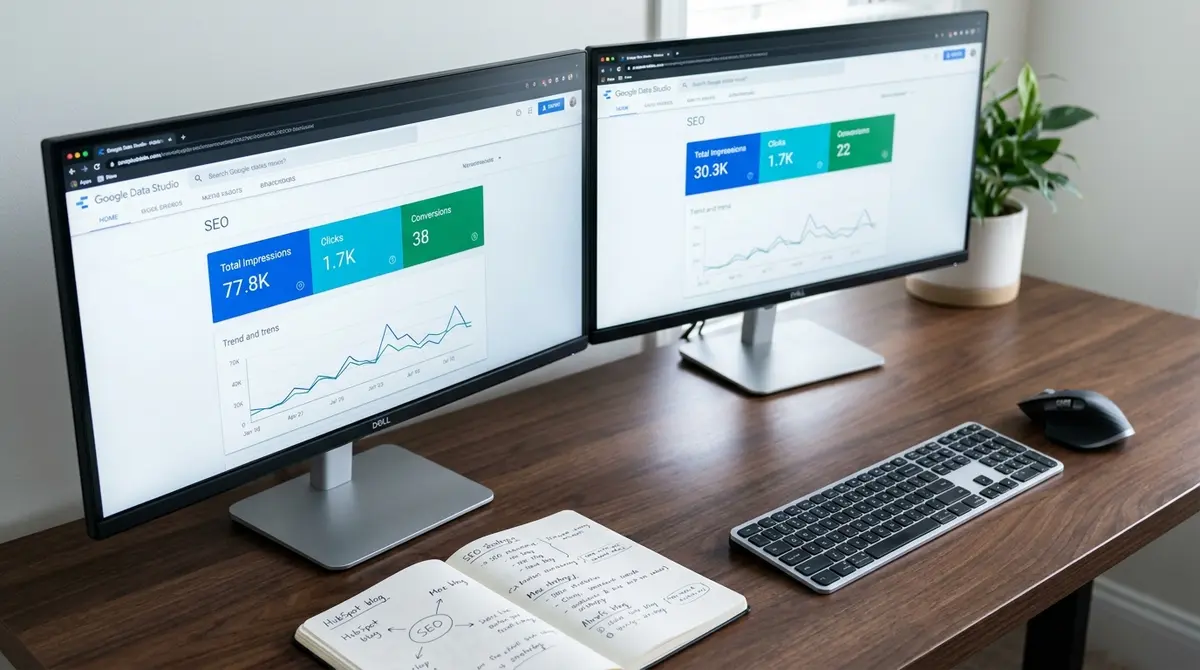
The short answer: A Google Data Studio SEO dashboard centralizes organic performance data from Google Search Console, Analytics, and third-party tools into live visual reports. Success comes down to metric selection (impressions, clicks, conversions), data source integration (API connectors vs manual imports), and refresh frequency (real-time vs daily). According to SE Ranking's 2025 analysis, marketers using centralized SEO dashboards reduce reporting time by 67% compared to manual spreadsheet compilation. If you cannot track which content earns those citations alongside traditional organic clicks, you are measuring half the picture, which is why understanding Perplexity SEO matters as much as traditional Google rankings in 2026.
Most businesses track SEO performance in spreadsheets. They export Google Search Console data on Monday, pull Analytics numbers on Tuesday, and spend Wednesday reconciling the differences. By Thursday, the data is already outdated. By Friday, they have no idea whether organic traffic is actually driving revenue.
A Google Data Studio SEO dashboard solves this problem by connecting directly to your data sources and updating automatically. You see impressions, clicks, rankings, and conversions in one place. No exports. No copy-paste errors. No guessing whether last month's traffic spike translated into leads.
The shift matters because AI search is fragmenting where your audience finds you. 50% of US Google queries now trigger AI Overviews (DemandSage 2025), and those overviews cite 3-5 brands per query. If you cannot track which content earns those citations alongside traditional organic clicks, you are measuring half the picture. Dashboards built in 2024 tracked rankings and traffic. Dashboards built in 2026 must track AI visibility, voice search appearances, and cross-platform content performance.
This guide covers how to build a Google Data Studio SEO dashboard that tracks what matters: organic revenue, not just traffic. You will learn which metrics to prioritize, how to connect data sources without technical expertise, and how to design reports that show ROI in 30 seconds instead of 30 minutes.
What Is a Google Data Studio SEO Dashboard and Why It Matters
Google Data Studio, now rebranded as Looker Studio but still widely called Data Studio, is a free web-based reporting tool that turns raw data into visual dashboards. For SEO, that means pulling metrics from Google Search Console, Google Analytics 4, and third-party platforms into charts, tables, and scorecards that update automatically.
The tool itself is free. You connect data sources through API integrations or manual uploads, design your layout with drag-and-drop widgets, and share the live dashboard with stakeholders. No software installation. No licensing fees. Just a Google account and the data sources you want to visualize.
Why this matters: According to Firework's 2025 research, only 8% of marketers feel confident they can measure marketing ROI. The rest are drowning in data but starving for insights. A Google Data Studio SEO dashboard does not create new data. It makes existing data actionable by showing trends, anomalies, and outcomes in seconds instead of hours.
How Google Data Studio SEO Dashboard Differs from Manual Reporting
Manual reporting means exporting CSVs from Google Search Console, copying them into Excel, building pivot tables, and emailing static PDFs to your team. When someone asks a follow-up question, you rebuild the report. When data changes, the PDF is wrong.
A Google Data Studio SEO dashboard connects to live data. When impressions drop 20% on Tuesday, the dashboard reflects it Tuesday. When a blog post starts ranking for 50 new keywords, you see it without exporting anything. Stakeholders view the same dashboard you do, with the same real-time numbers.
The time savings compound. Businesses that blog generate 126% more leads than those that do not (DemandSage 2025), but only if they can measure which content drives those leads. Manual reporting takes 3-5 hours per week. A dashboard built once updates forever.
Core Components Every SEO Dashboard Needs
A functional Google Data Studio SEO dashboard includes five elements: organic traffic trends (sessions, users, new vs returning), search performance metrics (impressions, clicks, CTR, average position from Search Console), conversion tracking (goal completions, form fills, revenue attributed to organic channels), page-level performance (which URLs drive traffic and conversions), and device and geography breakdowns (mobile vs desktop, country-level performance).
Without these components, you are tracking activity instead of outcomes. A dashboard that shows 10,000 monthly organic sessions means nothing if you cannot see how many of those sessions became customers. Businesses that track conversions alongside traffic see the full ROI picture. Those that track only rankings and clicks are guessing.
| Factor | What it is | Impact |
|---|---|---|
| Metric selection | Which KPIs appear in the dashboard | High – wrong metrics hide real performance |
| Data source integration | How tools connect to Data Studio | High – broken connections mean stale data |
| Refresh frequency | How often data updates automatically | Medium – daily is sufficient for most SEO |
| Visualization design | Chart types and layout clarity | Medium – poor design slows decision-making |
| Access control | Who can view or edit the dashboard | Low – but critical for client reporting |
Which Data Sources Should Your Google Data Studio SEO Dashboard Connect To?
A Google Data Studio SEO dashboard is only as valuable as the data sources feeding it. Most businesses start with Google Search Console and Google Analytics 4 because they are free, owned by the same company, and cover 80% of core SEO metrics. But stopping there leaves gaps.
Google Search Console shows impressions, clicks, average position, and CTR for every query and URL. It answers which keywords drive visibility and which pages rank. Google Analytics 4 shows sessions, conversions, revenue, engagement time, and user behavior. It answers what happens after the click. Together, they connect visibility to outcomes.
The limitation: neither tool tracks backlinks, keyword rankings across search engines beyond Google, or AI search visibility. For that, you need third-party integrations. Platforms like backlink analysis software, keyword research platform, and domain authority tool offer Data Studio connectors that pull ranking data, backlink profiles, and domain authority metrics into your dashboard. Some require paid connector tools. Others export to Google Sheets, which Data Studio reads natively.
Google Search Console: The Foundation of Organic Performance Tracking
Google Search Console is the most critical data source for any Google Data Studio SEO dashboard. It provides the only official data on how your site appears in Google search results: impressions (how many times your URLs appeared in search), clicks (how many times users clicked through), CTR (click-through rate), and average position (where your URLs rank on average).
The connector is native and free. You authorize Data Studio to access Search Console, select your property, and the data flows automatically. No API keys. No manual exports. The data refreshes daily, with a 2-3 day lag for finalized numbers.
What Search Console does not show: conversions, revenue, or on-site behavior. It tells you what happened in search results, not what happened after the visitor arrived. That is where Analytics enters.
Google Analytics 4: Connecting Visibility to Revenue
Google Analytics 4 tracks what happens after the click. For a Google Data Studio SEO dashboard, that means tying organic sessions to conversions. You can see which landing pages drive form fills, which blog posts lead to product purchases, and which organic channels (direct, referral, organic search) generate the highest lifetime value customers.
The GA4 connector is also native and free. You link your GA4 property to Data Studio, and metrics like sessions, engaged sessions, conversions, and revenue become available as dashboard widgets. You can filter by traffic source (organic search), medium (organic), or campaign (if you tag URLs).
SEO leads close at 14.6% compared to 1.7% for outbound leads (Search Engine Journal). But you only know that if you track conversions by source. A dashboard that shows 50,000 organic sessions but zero conversion data is a vanity metric. One that shows 50,000 sessions and 730 conversions (1.46% conversion rate) is a business decision tool.
How Do You Build a Google Data Studio SEO Dashboard from Scratch?
Building a Google Data Studio SEO dashboard takes 30-90 minutes depending on how many data sources you connect and how complex your layout becomes. The process follows five steps: create a blank report, connect your data sources, add charts and scorecards, apply filters and date controls, and share the dashboard with stakeholders.
Start by visiting datastudio.google.com and clicking "Create" then "Report." You will be prompted to connect a data source. Choose Google Search Console or Google Analytics 4 first. Authorize access. Select the property or view you want to report on. Data Studio pulls the available dimensions and metrics.
Once connected, you see a blank canvas. The toolbar on the right lets you add charts (line, bar, pie, table), scorecards (single-number widgets), and text boxes. Drag a scorecard onto the canvas. Select "Clicks" as the metric. You now have a live widget showing total clicks from Search Console. Repeat for impressions, CTR, and average position.
Designing for Clarity: What Metrics to Prioritize
A Google Data Studio SEO dashboard fails when it shows everything and prioritizes nothing. The best dashboards answer one question in 10 seconds: is organic performance improving or declining, and why? Google Data Studio, now rebranded as Looker Studio but still widely called Data Studio, is a free web-based reporting tool that turns raw data into visual dashboards, and building a Looker Studio SEO dashboard follows the same principles with updated branding.
Prioritize these metrics at the top of your dashboard: total organic sessions (from GA4), total impressions and clicks (from Search Console), conversion rate and total conversions from organic traffic (from GA4), and top 10 landing pages by sessions and conversions (from GA4). These four widgets tell you volume, visibility, outcomes, and which content works.
Below that, add trend charts: organic sessions over time (line chart, last 90 days), impressions and clicks over time (line chart, last 90 days), and top queries by impressions (table, last 30 days). These show direction and identify anomalies. If impressions drop 40% in one week, you see it immediately.
Adding Filters and Date Controls for Flexibility
Static dashboards become obsolete fast. A Google Data Studio SEO dashboard should let viewers adjust date ranges, filter by device (mobile vs desktop), and isolate specific landing pages or queries without editing the report.
Add a date range control at the top of your dashboard. Click "Add a control" in the toolbar, select "Date range control," and place it prominently. Now viewers can toggle between last 7 days, last 30 days, or custom ranges. The entire dashboard updates based on their selection.
Add dimension filters for device category (mobile, desktop, tablet) and country. These let you answer questions like "How is mobile organic traffic performing compared to desktop?" or "Which countries drive the most conversions?" Without filters, you are stuck with aggregated data that hides important patterns.
What Are the Most Common Mistakes When Building a Google Data Studio SEO Dashboard?
The most common mistake is tracking metrics that do not connect to business outcomes. A dashboard showing 50 widgets with average time on page, bounce rate, pages per session, and exit rate looks complete but answers nothing. Stakeholders leave confused instead of informed.
According to Firework's 2025 research, only 8% of marketers feel confident measuring ROI. The other 92% are likely tracking the wrong metrics. A Google Data Studio SEO dashboard should show revenue or leads attributed to organic traffic, not just engagement proxies like bounce rate.
Another mistake: ignoring data freshness. Google Search Console data lags 2-3 days. If your dashboard shows "last updated 8 days ago," stakeholders lose trust. Set up automatic refresh schedules in Data Studio (under "Resource" > "Manage added data sources" > "Refresh fields"). Daily refresh is standard for SEO dashboards.
Over-Complicating the Layout
Dashboards with 15 charts crammed onto one page overwhelm viewers. They scroll, squint, and give up. A Google Data Studio SEO dashboard should communicate the most critical insights above the fold. Everything else goes on a second page or gets cut.
Use a pyramid structure: scorecards at the top (total clicks, sessions, conversions), trend charts in the middle (performance over time), and detailed tables at the bottom (query-level or page-level breakdowns). Viewers see the headline numbers first, then drill down if needed.
White space matters. Leave breathing room between widgets. Use section headers to group related metrics. A cluttered dashboard takes 5 minutes to interpret. A clean one takes 30 seconds.
Failing to Track Conversions by Landing Page
Many Google Data Studio SEO dashboards show total organic sessions and total conversions, but they do not connect the two at the page level. You end up knowing that organic traffic drove 200 conversions last month, but you have no idea which blog posts or service pages generated them.
Fix this by adding a table widget that shows landing page (dimension), sessions (metric), and conversions (metric). Sort by conversions descending. Now you see exactly which URLs drive business outcomes. You can double down on high-converting content and fix or remove low-converting pages.
Businesses that track page-level conversion data make better content decisions. Those that track only aggregate numbers are flying blind. The difference is a dashboard that informs strategy versus one that reports vanity metrics.
See How Your Business Shows Up in AI Search
Get a free AI visibility scan. See exactly where you rank on ChatGPT, Perplexity, and Google AI, and what to do about it. Get Your Free Scan.
How Does a Google Data Studio SEO Dashboard Adapt to AI Search and Voice?
Traditional SEO dashboards track Google rankings, clicks, and conversions. But 50% of US Google queries now trigger AI Overviews (DemandSage 2025), and AI search adoption doubled from 14% to 29% in the first half of 2026 (Exposure Ninja 2025). A Google Data Studio SEO dashboard built in 2026 must track AI visibility alongside traditional metrics.
AI Overviews, ChatGPT, Perplexity, and voice assistants like Siri and Alexa do not send traditional organic clicks. They cite sources within answers. If your business is cited, you gain brand visibility and authority. If you are not cited, your competitor is. The problem: Google Search Console does not track AI Overview appearances or voice search queries. A functional Google Data Studio SEO dashboard includes five elements: organic traffic trends, search performance metrics, conversion tracking, page-level performance, and device and geography breakdowns, which are the same core components every SEO performance dashboard requires regardless of platform.
The solution requires third-party data or manual tracking. Some platforms now offer AI search monitoring tools that detect when your content appears in AI-generated answers. You can export that data to Google Sheets and pull it into your Google Data Studio SEO dashboard. Alternatively, you can manually log AI citations and track them as a custom metric.
Tracking AI Overview Appearances as a New KPI
Brands cited in AI Overviews receive 35% more organic clicks than those not cited (Dataslayer 2025). That makes AI visibility a revenue-driving metric, not a vanity stat. A Google Data Studio SEO dashboard should include a widget showing AI Overview appearances over time, percentage of target queries where your brand is cited, and competitor citation rates for comparison.
To track this, you need a data source that monitors AI Overviews. Some SEO platforms now offer this feature. If yours does not, you can manually query target keywords in Google and log whether an AI Overview appears and whether your brand is cited. Store the data in Google Sheets with columns for date, query, AI Overview present (yes/no), and your brand cited (yes/no).
Connect that Google Sheet to your Google Data Studio SEO dashboard. Add a scorecard showing total AI citations this month. Add a line chart showing AI citations over time. Now you are tracking the metric that determines whether your content reaches audiences in 2026 search environments.
Voice Search and Featured Snippet Tracking
Voice search queries phrase differently than typed queries. Someone typing might search "best CRM software." Someone speaking asks "What is the best CRM software for small businesses?" A Google Data Studio SEO dashboard should track how often your content ranks for question-based queries, which pages appear in featured snippets, and which queries trigger voice search results.
Google Search Console provides some of this data. Filter by query type to isolate question queries (queries containing "how," "what," "why," "when," "where"). Add a table to your dashboard showing top question queries by impressions and clicks. This reveals which voice-friendly content is already working.
Featured snippets are the answer boxes Google displays at the top of search results. They are the primary source for voice search answers. Track featured snippet ownership by monitoring position 0 rankings in your rank tracking tool, or by manually checking target queries and logging which URLs own the snippet. A Google Data Studio SEO dashboard that tracks featured snippet wins shows whether your content is optimized for voice search.
What Reporting Frequency and Access Controls Work Best?
A Google Data Studio SEO dashboard is only useful if stakeholders check it regularly and trust the data they see. That requires the right reporting frequency and access controls. Most businesses review SEO performance weekly or monthly. Daily reviews create noise. Quarterly reviews miss opportunities.
Set your dashboard to refresh data daily. Google Search Console and Google Analytics 4 both support daily data pulls with 1-3 day lags. That means Monday's dashboard shows data through Friday or Saturday. For SEO, that is fresh enough to spot trends and react quickly.
Access controls matter because not everyone needs edit permissions. Viewers should see the dashboard but not change it. Editors can modify layouts and add widgets. Owners control who has access. Set up three permission tiers: owner (you or the person who built the dashboard), editors (marketing team members who may need to adjust metrics), and viewers (executives, clients, or stakeholders who need to see results but not touch the report).
Scheduled Email Reports vs Live Dashboard Access
Data Studio offers two delivery methods: scheduled email reports and live dashboard links. Scheduled reports send a PDF or link to the dashboard on a set schedule (weekly, monthly). Live links give stakeholders real-time access whenever they want to check performance.
For executives who want a monthly summary, scheduled email reports work. They receive a PDF showing last month's performance without logging into Data Studio. For marketing teams who need to monitor performance continuously, live dashboard links work better. They bookmark the URL and check it whenever needed. SEO leads close at 14.6% compared to 1.7% for outbound leads, which is one reason the Google Ads vs SEO debate matters so much for service businesses tracking cost per acquisition.
The best approach combines both. Send a monthly email report summarizing key trends (sessions up 12%, conversions up 8%, top-performing content). Include a link to the live Google Data Studio SEO dashboard for anyone who wants to drill deeper. This satisfies both audiences: those who want a quick summary and those who want granular data.
Version Control and Dashboard Documentation
Dashboards evolve. You add metrics, remove underperforming widgets, and adjust layouts based on stakeholder feedback. Without version control, you lose track of what changed and why. Data Studio does not have built-in version history like Google Docs, so you need a manual process.
Before making major changes to your Google Data Studio SEO dashboard, duplicate the report. Name it "SEO Dashboard v1.0" or "SEO Dashboard – Jan 2026." Make changes to the new version. If stakeholders prefer the old layout, you can revert. If they like the new one, archive the old version.
Document what each widget shows and why it matters. Add text boxes to your dashboard explaining metrics. Example: "Organic sessions measures total visits from Google, Bing, and other search engines. Increases here indicate growing visibility." This prevents confusion and reduces the number of questions you field from stakeholders.
The Bottom Line on Google Data Studio SEO Dashboards
A Google Data Studio SEO dashboard turns fragmented data into a single source of truth. Instead of exporting CSVs and building pivot tables every Monday, you connect data sources once and the dashboard updates automatically. You see impressions, clicks, conversions, and revenue in real time. Stakeholders stop asking "How is SEO performing?" because they can check the dashboard themselves.
The businesses that win with SEO dashboards are those that track outcomes, not activity. They measure conversions and revenue attributed to organic traffic, not just rankings and sessions. They connect Google Search Console to Google Analytics 4 so they see both visibility and business impact. They track AI search citations alongside traditional organic clicks because AI search adoption doubled in six months and is not slowing down.
Build your dashboard around five core components: organic traffic trends, search performance metrics, conversion tracking, page-level performance, and device and geography breakdowns. Prioritize clarity over complexity. A dashboard with 10 well-chosen metrics beats one with 50 poorly explained widgets. Add filters and date controls so stakeholders can explore data without editing the report. Refresh data daily so the numbers stay trustworthy.
Frequently Asked Questions
How long does it take to build a Google Data Studio SEO dashboard?
Building a basic Google Data Studio SEO dashboard takes 30-60 minutes. Connect Google Search Console and Google Analytics 4, add scorecards for clicks and sessions, insert trend charts, and apply date filters. Advanced dashboards with third-party integrations, custom metrics, and multi-page layouts take 2-4 hours.
Can I track AI search visibility in a Google Data Studio SEO dashboard?
Yes, but it requires third-party data or manual tracking. Google Search Console does not report AI Overview appearances. Use platforms that monitor AI search citations, export the data to Google Sheets, and connect that sheet to your dashboard. Track AI citations as a custom metric alongside traditional organic clicks.
What is the difference between Google Data Studio and Looker Studio?
They are the same product. Google rebranded Data Studio as Looker Studio in 2022, then reverted to the Data Studio name in 2026. The tool, features, and functionality remain identical. Both names refer to Google's free web-based reporting and dashboard platform.
How do I measure ROI from organic content using a Google Data Studio SEO dashboard?
Connect Google Analytics 4 to track conversions by traffic source. Set up goals or conversion events for form fills, purchases, or demo requests. Add a table widget showing landing page, sessions, and conversions. Calculate revenue per session or cost per acquisition. This shows which organic content drives measurable business outcomes, not just traffic.
Can I build a Google Data Studio SEO dashboard in-house or do I need an agency?
You can build it in-house if you have time to learn Data Studio's interface and connect data sources. The tool is free and user-friendly for basic dashboards. Complex setups with custom API integrations, calculated fields, or advanced visualizations may require technical expertise. Platforms like Strategyc's Content & Visibility Engine install owned reporting systems that track SEO and AI search performance without monthly agency retainers.