Build a Looker Studio SEO Dashboard That Drives Decisions
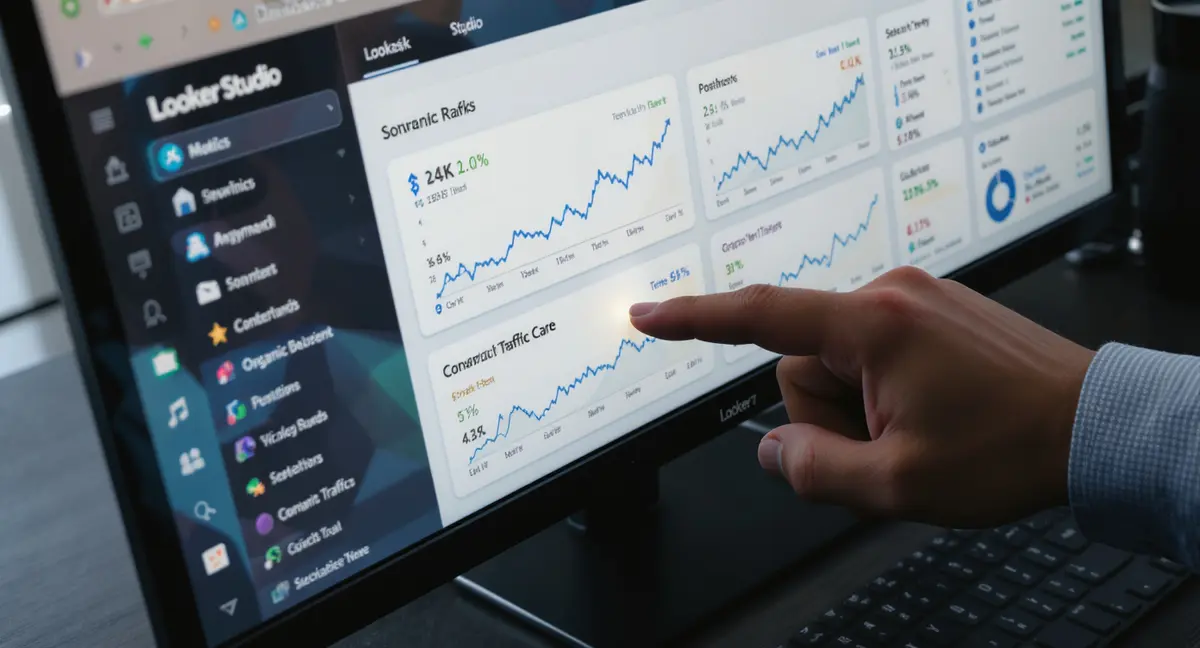
The short answer: A Looker Studio SEO dashboard consolidates Google Search Console, GA4, and rank tracking data into a single visual report that shows what's working and what isn't. Success in dashboard reporting comes down to metric selection, data freshness, and decision-making speed. According to Backlinko, organic CTR for position 1 is 27.6%, making rank tracking essential. If you're already tracking traditional search visibility, Perplexity SEO strategies can help you capture citations in AI-generated answers before your competitors do.
Most businesses drown in SEO data but starve for actionable information. You've got Google Search Console showing clicks and impressions. Google Analytics 4 tracking sessions and conversions. Maybe a rank tracker somewhere else. And you're switching between three tabs trying to figure out if your content strategy is actually working. A Looker Studio SEO dashboard solves that problem by pulling everything into one place. You see rank movement, traffic trends, and conversion data side by side. No more exporting CSVs or copying numbers into spreadsheets. The dashboard updates automatically, and you can share it with your team or clients without giving away login credentials. But here's the catch: most dashboard templates are built for vanity metrics, not decisions. They show you pretty charts without telling you what to do next. This article breaks down how to build a Looker Studio SEO dashboard that actually moves the needle, what metrics matter, how to structure your data sources, and what separates a reporting tool from a decision-making system.What Makes a Looker Studio SEO Dashboard Different From Other Reporting Tools
A Looker Studio SEO dashboard isn't just another analytics platform. It's a free, customizable reporting layer that sits on top of your existing data sources. Unlike proprietary dashboards locked inside SEO tools, Looker Studio connects directly to Google Search Console, GA4, and third-party connectors, giving you full control over what you see and how you see it.Why Businesses Choose Looker Studio for SEO Reporting
The primary advantage is ownership. When you build a Looker Studio SEO dashboard, you own the report structure, the data connections, and the historical record. If you switch SEO tools or agencies, the dashboard stays with you. According to HubSpot's State of Marketing 2024, companies that blog get 55% more website visitors, but only if they can track what content performs. Looker Studio makes that tracking permanent. Cost is the second factor. Looker Studio is free. You're not paying $200/month for a reporting add-on or $500/month for white-label dashboards. You're connecting free data sources (Search Console, GA4) with free visualization tools. The only cost is setup time. For businesses already paying $1,500-$5,000/month for SEO services (backlink analysis software, 2024), eliminating reporting fees matters. The third advantage is customization. Pre-built dashboards from SEO platforms show you what the platform thinks matters. A Looker Studio SEO dashboard shows you what *you* decide matters. You can track branded vs non-branded queries, compare landing page performance by topic cluster, or isolate mobile vs desktop rankings. If your business model depends on local search, you can build a dashboard that tracks city-level visibility. If you're an ecommerce brand, you can connect revenue data directly to organic traffic sources.How Looker Studio Connects to Your SEO Data Sources
Looker Studio uses native connectors and third-party integrations to pull data. The native Google Search Console connector gives you queries, clicks, impressions, CTR, and average position. The GA4 connector provides sessions, users, bounce rate, conversions, and revenue. Both update automatically, no manual exports. For rank tracking, backlink monitoring, and technical audit data, you'll need third-party connectors. These are typically offered by SEO platforms that want to integrate with Looker Studio. Some are free; others require a subscription to the underlying tool. The connector acts as a bridge, pulling data from the platform's API into Looker Studio's reporting interface. Data blending is where Looker Studio becomes powerful. You can combine Search Console query data with GA4 session data to see which keywords drive the most engaged traffic. You can blend rank tracking data with conversion data to identify which position improvements actually increased revenue. According to Search Engine Journal, SEO leads have a 14.6% close rate vs 1.7% for outbound, but only if you can connect rankings to pipeline.| Factor | What it is | Impact |
|---|---|---|
| Data source selection | Which tools you connect to the dashboard | High, determines what you can measure |
| Metric hierarchy | Which KPIs appear at the top of the report | High, shapes what your team prioritizes |
| Update frequency | How often data refreshes in the dashboard | Medium, daily is standard, hourly rarely needed |
| Visualization type | Charts, tables, scorecards, or time series | Medium, affects interpretation speed |
| Filter and segment options | Ability to drill down by device, location, page type | High, enables root-cause analysis |
How to Structure Your Dashboard for Decision-Making, Not Just Data Display
Most Looker Studio SEO dashboards fail because they're built for reporting, not action. You open the dashboard, see a bunch of numbers, and close it without knowing what to do next. The difference between a reporting tool and a decision-making system is structure.Start With Outcome Metrics, Not Activity Metrics
The top of your Looker Studio SEO dashboard should answer one question: are we winning or losing? That means leading with outcome metrics, organic revenue, qualified leads from organic search, or conversion rate by landing page. Activity metrics like total clicks or impressions come second. Consider a B2B service business. The dashboard should show organic-sourced leads at the top, then click volume, then impressions. If clicks are up 40% but leads are flat, you know the problem isn't visibility, it's conversion. According to Demand Gen Report 2024, B2B buyers consume 3-7 content pieces before engaging sales, so tracking content engagement depth matters more than raw traffic. For ecommerce, the top metric is organic revenue, followed by transactions, average order value, and assisted conversions. If revenue is growing but average order value is dropping, you're attracting more low-intent traffic. The dashboard should surface that pattern immediately.Use Comparison Periods to Spot Trends, Not Just Snapshots
A single number tells you nothing. A Looker Studio SEO dashboard should default to comparison views, this month vs last month, this quarter vs last quarter, this year vs last year. Organic search is seasonal. A 15% traffic drop in January might be normal for your industry, or it might signal a ranking loss. You can't tell without historical context. Set up automatic date range comparisons in Looker Studio. When someone opens the dashboard, they should see current performance next to prior-period performance, with percentage change highlighted. Green for growth, red for decline. No mental math required. Also track year-over-year growth separately from month-over-month. Month-over-month shows short-term volatility. Year-over-year shows compounding progress. A content strategy that increases organic traffic 8% per month compounds to 151% annual growth. But if you're only looking at monthly snapshots, you won't see the compounding effect.Build Segmentation Into Every View
The aggregate number is almost always misleading. Total organic traffic might be up, but if all the growth is coming from low-intent informational queries, your business isn't growing. A Looker Studio SEO dashboard should segment every metric by intent, device, location, and page type. Segment queries by intent using Search Console filters. Branded queries (your company name) vs non-branded (your product category). Navigational queries (people looking for your homepage) vs informational (people researching solutions). Commercial queries (people comparing options) vs transactional (people ready to buy). Each segment converts at a different rate. According to industry research, commercial-intent organic traffic converts 3-5x higher than informational traffic. Segment traffic by device. Mobile search behavior is different from desktop. If your mobile conversion rate is 1.2% and desktop is 4.8%, you need to know which device is driving your traffic growth. A Looker Studio SEO dashboard can show device-level performance in one chart. Segment by landing page category. If you publish case studies, blog posts, product pages, and service pages, track each category separately. You'll often find that 20% of your content drives 80% of your conversions. The dashboard should make that visible.What Data Sources to Connect and How to Blend Them Effectively
A Looker Studio SEO dashboard is only as good as the data you feed it. Most businesses connect Google Search Console and call it done. That gives you visibility data but no context. To build a decision-making system, you need at least three data sources blended together.Google Search Console for Visibility and Click Data
Google Search Console is the foundation. It shows which queries trigger your pages in search results, how often people click, and what position you rank. The native Looker Studio connector pulls this data automatically. The key metrics to track: total clicks, total impressions, average CTR, and average position. But don't stop there. Use Search Console's query-level data to identify high-impression, low-CTR queries. These are keywords where you rank well enough to show up, but your title and meta description aren't compelling enough to earn clicks. According to Backlinko 2024, organic CTR for position 1 is 27.6%, but many businesses see 12-15% because their snippets don't sell the click. Also track position distribution. How many queries rank in positions 1-3 vs 4-10 vs 11-20? A healthy SEO strategy should show consistent movement from page 2 to page 1. If your position distribution is static, your content isn't improving.Google Analytics 4 for Engagement and Conversion Data
GA4 tells you what happens after the click. Sessions, users, bounce rate, average session duration, conversions, and revenue. The GA4 connector in Looker Studio pulls this data in real time. The most important GA4 metric for SEO is conversion rate by traffic source. Filter for organic search traffic, then measure how many sessions convert to leads or sales. If your organic conversion rate is 2.1% and paid search is 4.3%, you know your organic landing pages need work. According to SingleGrain 2025, AI-sourced visitors convert at 27% vs 2.1% from traditional search, which means optimizing for AI search answers could 10x your conversion rate. Also track engagement metrics by landing page. Which blog posts or service pages hold attention longest? Which pages have the highest scroll depth? GA4's engagement rate metric (sessions with 10+ seconds of activity or 2+ page views) is a better signal than bounce rate. High engagement + low conversions means your content is interesting but not persuasive. Low engagement + low conversions means the content isn't relevant to the query.Third-Party Rank Tracking for Position Monitoring
Google Search Console shows average position across all impressions, but it doesn't track specific keyword rankings over time. For that, you need a rank tracker. Most rank tracking platforms offer Looker Studio connectors that pull daily position data into your dashboard. Track your top 20-50 target keywords. These should be the queries that drive the most revenue or leads for your business. A Looker Studio SEO dashboard should show current position, 7-day change, 30-day change, and 90-day change for each keyword. If a keyword drops from position 3 to position 8, you need to know immediately. Also track competitor rankings for the same keywords. If your position is stable but your competitor moved from position 6 to position 2, they're doing something you're not. The dashboard should surface competitive threats before they cost you traffic.How to Blend Data Sources Without Breaking Your Dashboard
Data blending in Looker Studio combines two or more data sources into a single chart or table. For example, you can blend Search Console query data with GA4 conversion data to see which keywords drive the most conversions. The key is matching dimensions. Search Console uses "query" as a dimension. GA4 uses "session source/medium" and "landing page." To blend them, you need a common dimension, usually landing page URL. Create a blended data source that joins Search Console landing page data with GA4 landing page data. Now you can see clicks, impressions, sessions, and conversions in one table. Don't over-blend. Each blend adds complexity and slows down the dashboard. Start with one or two blends that answer your most important questions. For most businesses, that's "which pages drive the most organic traffic and conversions?" and "which queries have the highest commercial intent?"How to Customize Templates vs Building From Scratch
You've got two options when creating a Looker Studio SEO dashboard: start with a template or build from scratch. Templates are faster. Custom builds are more precise. The right choice depends on how much your reporting needs differ from the standard SEO playbook.When to Use a Pre-Built Template
Templates work when your SEO strategy is straightforward. You're tracking the same metrics as everyone else: clicks, impressions, rankings, conversions. You don't need custom segments or unusual data blends. You just want a clean, functional dashboard without spending 10 hours building it. Most Looker Studio SEO dashboard templates include: a Search Console overview page, a GA4 traffic page, a rankings page (if you connect a rank tracker), and a conversions page. They're designed for general use, which means they'll cover 70-80% of what most businesses need. The downside is rigidity. Templates are built for the average use case. If your business tracks local rankings across 15 cities, or if you need to separate B2B and B2C traffic, or if you want to measure content performance by topic cluster, the template won't have those views pre-built. You'll spend time customizing anyway.When to Build a Custom Dashboard
Build from scratch when your reporting needs are specific. You're tracking metrics that don't appear in standard templates. You need custom calculations, like "organic revenue per published article" or "average position improvement per month." You want full control over layout, color scheme, and filter options. Custom dashboards take longer, expect 6-10 hours for a full build if you're new to Looker Studio. But you'll end up with a reporting system that matches your strategy exactly. Every chart answers a question you actually ask. Every filter lets you drill into the data you actually need. The process: start with a blank report, connect your data sources, add one page at a time. Page 1 is your executive summary, top-line metrics only. Page 2 is Search Console deep dive. Page 3 is GA4 traffic and conversions. Page 4 is rankings and competitor tracking. Each page should answer one question.How to Modify Templates Without Breaking Them
If you start with a template, you'll want to customize it. The safest approach: duplicate the template first, then modify the copy. That way, if you break something, you can revert to the original. Common customizations: change the date range to match your reporting cycle (monthly, quarterly, annual). Add filters for device, location, or page type. Swap out charts, maybe you prefer tables over bar graphs, or scorecards over time series. Adjust the color scheme to match your brand. The most common mistake is breaking data source connections. If the template uses a blended data source and you delete one of the underlying sources, every chart using that blend will error out. Before you delete anything, check which charts depend on it.See How Your Business Shows Up in AI Search
Get a free AI visibility scan. See exactly where you rank on ChatGPT, Perplexity, and Google AI, and what to do about it. Get Your Free Scan. For teams still using the legacy platform, our Data Studio SEO dashboard guide covers the transition path and what changes when you migrate your reports.
What Metrics to Track and What to Ignore
A Looker Studio SEO dashboard can display hundreds of metrics. Most of them don't matter. The goal isn't to track everything, it's to track the 8-10 metrics that predict business outcomes.The Core Metrics That Predict Revenue and Leads
Start with these: organic sessions (from GA4), organic conversions (from GA4), organic revenue (from GA4 ecommerce tracking), total clicks (from Search Console), average position (from Search Console), and conversion rate by landing page (from GA4). These six metrics tell you if your SEO strategy is working. If organic sessions are up but conversions are flat, you're attracting the wrong traffic. If clicks are up but sessions are down, you've got a site speed or user experience problem. If average position is improving but clicks aren't, your CTR is too low. Add two more: pages indexed (from Search Console coverage report) and Core Web Vitals pass rate (from Search Console experience report). These are leading indicators. If Google stops indexing your pages, your traffic will drop in 30-60 days. If your Core Web Vitals fail, your rankings will erode over time. According to industry research, sites with good Core Web Vitals rank an average of 2-3 positions higher than sites with poor scores.Vanity Metrics That Look Good But Don't Drive Decisions
Ignore total impressions unless you're tracking brand awareness campaigns. Impressions measure how often your pages appear in search results, but they don't measure clicks or conversions. A page can have 100,000 impressions and 50 clicks. That's not success, that's a CTR problem. Ignore total keywords ranking. Some dashboards show "you rank for 12,487 keywords!" as if that's a win. It's not. Most of those keywords have zero search volume or zero commercial intent. What matters is how many high-intent keywords you rank in positions 1-5. Ignore average session duration unless you're a media site. For most businesses, session duration is a vanity metric. A 4-minute session doesn't mean the visitor is more likely to convert than a 90-second session. It might mean your site is confusing and they can't find what they need. Focus on conversion rate instead.How Often to Check Your Dashboard and What to Do With the Data
Check your Looker Studio SEO dashboard weekly for trend monitoring, monthly for performance reviews, and quarterly for strategic planning. Daily checks create noise. You'll react to normal fluctuations instead of real trends. Weekly: scan for anomalies. Did a high-value keyword drop 5+ positions? Did organic traffic spike or crash? Did a Core Web Vitals metric fail? These are early warning signals that need investigation. Monthly: review performance against goals. Are you on track to hit your quarterly organic traffic target? Which landing pages improved? Which declined? What content should you publish next based on what's working? Quarterly: assess strategy. Is your SEO approach still aligned with business goals? Should you shift focus from informational content to commercial content? Should you invest more in technical SEO or content production? The dashboard should inform these decisions with data, not opinions.Want to see where your content stands in Google, AI search, and voice search right now? Book a 30-minute Content & Visibility Scan, no commitment, just a clear picture of your current visibility. Once you've connected your data sources, building an effective SEO performance dashboard requires choosing metrics that actually influence business decisions rather than just looking impressive.
Common Dashboard Mistakes and How to Avoid Them
Most Looker Studio SEO dashboards fail because of design mistakes, not data mistakes. You connect the right sources, but you structure the report in a way that hides the information you need. Take a look at what to avoid.Mistake 1: Putting Too Many Metrics on One Page
A dashboard page should answer one question. If you're trying to show Search Console data, GA4 data, rank tracking data, and backlink data on the same page, you're overwhelming the viewer. They'll scan the page, see 15 charts, and close it without taking action. Solution: one page per data source or one page per question. Page 1 is your executive summary, just the top 5-6 metrics. Page 2 is Search Console deep dive. Page 3 is GA4 traffic and conversions. Page 4 is rankings. Each page should fit on one screen without scrolling.Mistake 2: Using the Wrong Chart Type for the Data
Time series data (traffic over time, rankings over time) should use line charts. Categorical data (traffic by device, traffic by landing page) should use bar charts or tables. Proportional data (percentage of traffic from branded vs non-branded queries) should use pie charts or stacked bar charts. The most common mistake: using a table when a chart would make the trend obvious. If you're tracking 30 days of organic traffic, a line chart shows the trend at a glance. A table makes you read 30 numbers and calculate the trend yourself.Mistake 3: Not Setting Up Alerts for Critical Metrics
A Looker Studio SEO dashboard is reactive unless you add alerts. You have to remember to check it. If a critical keyword drops from position 2 to position 12, you won't know until you open the dashboard. Solution: set up Google Analytics 4 custom alerts for traffic drops, conversion rate drops, or Core Web Vitals failures. Connect those alerts to email or Slack. Now you're notified when something breaks, and you can open the dashboard to investigate.How to Share Your Dashboard With Teams and Clients
A Looker Studio SEO dashboard is only useful if the right people can access it. Sharing settings determine who sees what, and whether they can edit or just view.Viewer vs Editor Permissions
Viewer access lets someone see the dashboard but not change it. This is the right setting for clients, executives, or team members who need to check performance but shouldn't modify the report structure. Editor access lets someone change charts, add pages, and modify data sources. This is the right setting for the person who maintains the dashboard. If you give editor access to too many people, someone will accidentally delete a chart or break a data blend. Most businesses should have one editor (the person who built the dashboard or the SEO lead) and multiple viewers (everyone else). If you're an agency, give clients viewer access only. If they want changes, they request them, they don't make them.How to Embed Dashboards in Client Portals or Internal Tools
Looker Studio lets you embed dashboards in websites or internal tools using an iframe. This is useful for agencies that want to white-label reporting or businesses that want to integrate SEO data into their internal BI system. To embed: open the dashboard, click Share, click Embed report, copy the iframe code. Paste it into your website or portal. The embedded dashboard updates automatically when the data refreshes. One limitation: embedded dashboards require viewer access. If someone doesn't have permission to view the dashboard, they'll see an error when they load the embedded version. Make sure your sharing settings allow the right people to access it.How to Schedule Automated Email Reports
Looker Studio can email a PDF snapshot of your dashboard on a schedule, daily, weekly, or monthly. This is useful for executives who want a weekly SEO summary in their inbox without logging into Looker Studio. To set up: open the dashboard, click Share, click Schedule email delivery. Choose the frequency, the recipients, and the pages to include. Looker Studio will generate a PDF and email it automatically. The downside: PDFs are static. The recipient can't drill into the data or change the date range. If they want to investigate a trend, they'll need to open the live dashboard. Use scheduled emails for high-level summaries, not detailed analysis.The Bottom Line
A Looker Studio SEO dashboard is only valuable if it changes what you do. The goal isn't to have a pretty report, it's to make faster, better decisions about where to invest your time and budget. That means building a dashboard around outcomes, not activities. It means tracking the 8-10 metrics that predict revenue and leads, not the 50 metrics that look impressive in a presentation. And it means checking the dashboard weekly, acting on what you find, and ignoring the noise.Frequently Asked Questions
How long does it take to build a Looker Studio SEO dashboard from scratch?
Expect 6-10 hours for a full custom build if you're new to Looker Studio. That includes connecting data sources, designing page layouts, building blended data sources, and testing filters. Using a template cuts that to 2-3 hours for basic customization. Beyond the standard metrics most businesses track, a properly configured SEO monitoring dashboard surfaces early warning signals that prevent ranking losses before they impact revenue. Before committing to a platform, understanding the ownership and portability differences across SEO dashboard software options will save you from vendor lock-in and data migration headaches.
Can I track AI search visibility in a Looker Studio SEO dashboard?
Not directly through native connectors. Google Search Console doesn't report AI Overview appearances separately yet. You'd need a third-party tool that tracks AI search citations and offers a Looker Studio connector, or manually log AI search appearances in a Google Sheet and connect that.
What's the difference between a Looker Studio SEO dashboard and Google Search Console?
Search Console is a data source. A Looker Studio SEO dashboard is a reporting layer that combines Search Console with GA4, rank tracking, and other sources. The dashboard lets you see all your SEO data in one place, with custom calculations and visualizations Search Console doesn't offer.
Do I need a developer to build a Looker Studio SEO dashboard?
No. Looker Studio is a drag-and-drop tool. If you can use Google Sheets, you can build a basic dashboard. Advanced features like calculated fields and complex data blends require some learning, but there's no coding involved.
How do I measure ROI from the content my Looker Studio SEO dashboard tracks?
Connect GA4 ecommerce tracking or CRM data to Looker Studio. Track organic revenue or lead value by landing page. Divide total organic revenue by your content production cost to calculate ROI. If you're generating $50,000/month in organic revenue and spending $5,000/month on content, your ROI is 10x.